Tutorial
Visualizing my time in Paris with a personal activity heatmap
ByAkash Bhave
Published on Monday, September 18, 2023

I spent two months in the summer of 2023 working and living in Paris, France.
After landing, I was immediately enamoured by the scope and efficiency of the Métro and the general transit network of Paris. After work, I would take a different Métro line to a new part of Paris and attempt to walk back home, stopping at landmarks and restaurants along the way. Some mornings, I would go for a jog around the Champ de Mars in front of the Effiel Tower.
A few weeks in, I decided to try to get a bicycle. I found a second-hand bicycle shop in the 10th arrondissement selling a vintage Peugot for a reasonable price. Going forward, I would cycle around the city nearly every day in an attempt to see as much of Paris as possible. On longer rides, I would take the RER to a distant suburb and cycle back. I was even able to complete a weekend bicycle tour, traveling 150 miles from Le Havre to Paris over two days.

Peugeot Competition (year unknown) with a (surprisingly light) steel frame and downtube shifters.
With all of this activity, I was determined to visualize my coverage of the Paris by making a personal activity heatmap.
Exporting the data
To record my activities, I used a Suunto GPS watch. The activities would sync from my watch to the Suunto app, then to Strava. Since Strava acted as a hub for all my activities, I decided to request the raw data from Strava. Fortunately, Strava has a Account Download and Deletion
page that allows for bulk download. Just make sure to only request a download and not a deletion. A download link for a ZIP archive was emailed to me after an hour.
Cleaning the data
Each activity that I recorded from my watch was exported as a .fit.gz compressed file, which I decompressed. There were also some uncompressed .fit files that came from direct recordings from my phone when I wasn't wearing my watch.
I converted all the .fit files into .gpx files using GPSBabel, a handy utility to convert between common GPS track files.
unknown
for filename in *.fit
gpsbabel -i garmin_fit -f "$filename" -o gpx -F (basename "$filename" .fit).gpx
endThe goal of converting into .gpx was to use ogr2ogr (another useful utility, provided by GDAL) to convert to GeoJSON.
unknown
for filename in ./*.gpx
ogr2ogr -t_srs EPSG:4326 -f "GeoJSON" -oo GPX_USE_EXTENSIONS=YES (basename "$filename" .gpx).json "$filename" tracks
endAt this point, I wanted to separate the files by activity type—ride, run, and walk. I cross-referenced the filename with the activities.csv file that was provided in the archive by Strava, which listed the activity type. After separating, I used ogr2ogr again to combine multiple GeoJSONs into a single GeoJSON activity bundle.
unknown
for filename in ./ride/*.gpx
ogr2ogr -f GeoJSON ride.json $filename -append
endThe last conversion was into shapefiles. Once again, ogr2ogr. I had to pass a few options to force the line string feature type.
unknown
ogr2ogr -nlt LINESTRING -skipfailures ride.shp ride.jsonI repeated the previous two command blocks for the run and walk activity bundles.
Building the heatmap
Now, it's time to put the heatmap together. Enter: Clockwork Micro's Map Tools, an online, low/no-code, geospatial tool suite (disclaimer: I'm involved in the development of Map Tools). Map Tools consists of a few modular services to publish interactive, dynamic maps from raw data.
File Tiler: create vector tiles
File Tiler is the first service I used in the heatmap creation process. Along with uploading my shapefile, I also configured the default viewport to be positioned at the center of Paris. I figured zoom bounds 3 to 16 were reasonable for the scope of the heatmap.
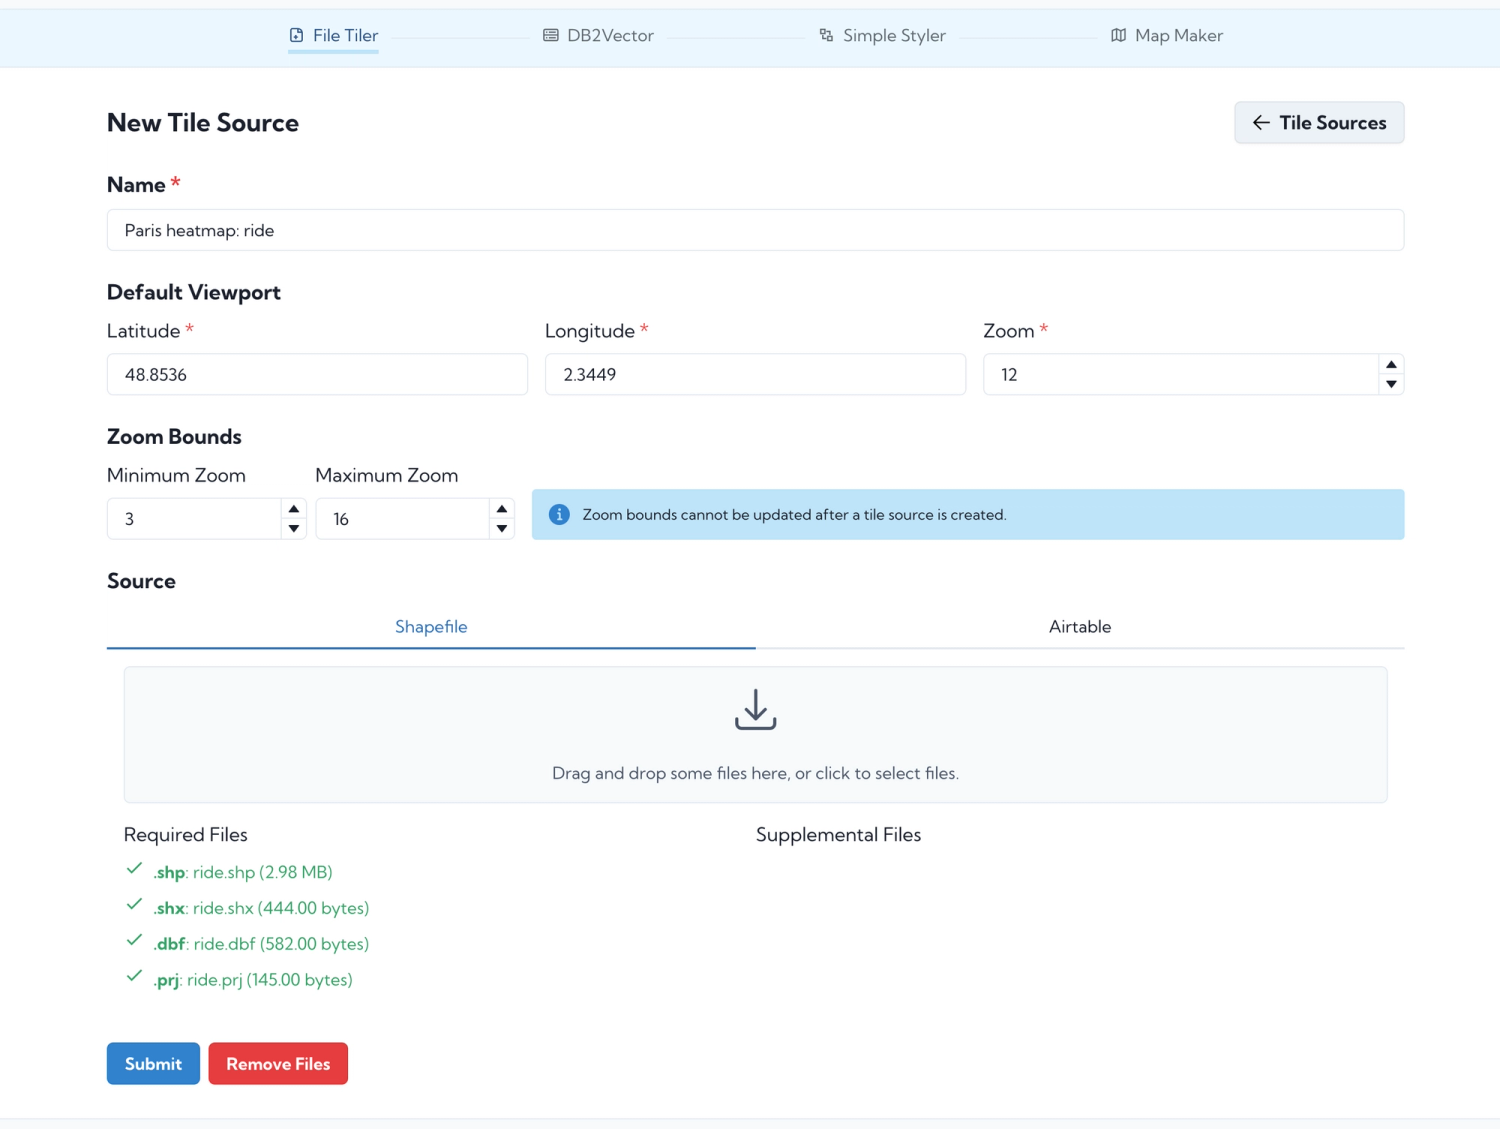
File Tiler creation page.
I repeated the creation process for the run and walk activity bundles, using the same default viewport and zoom bounds parameters.
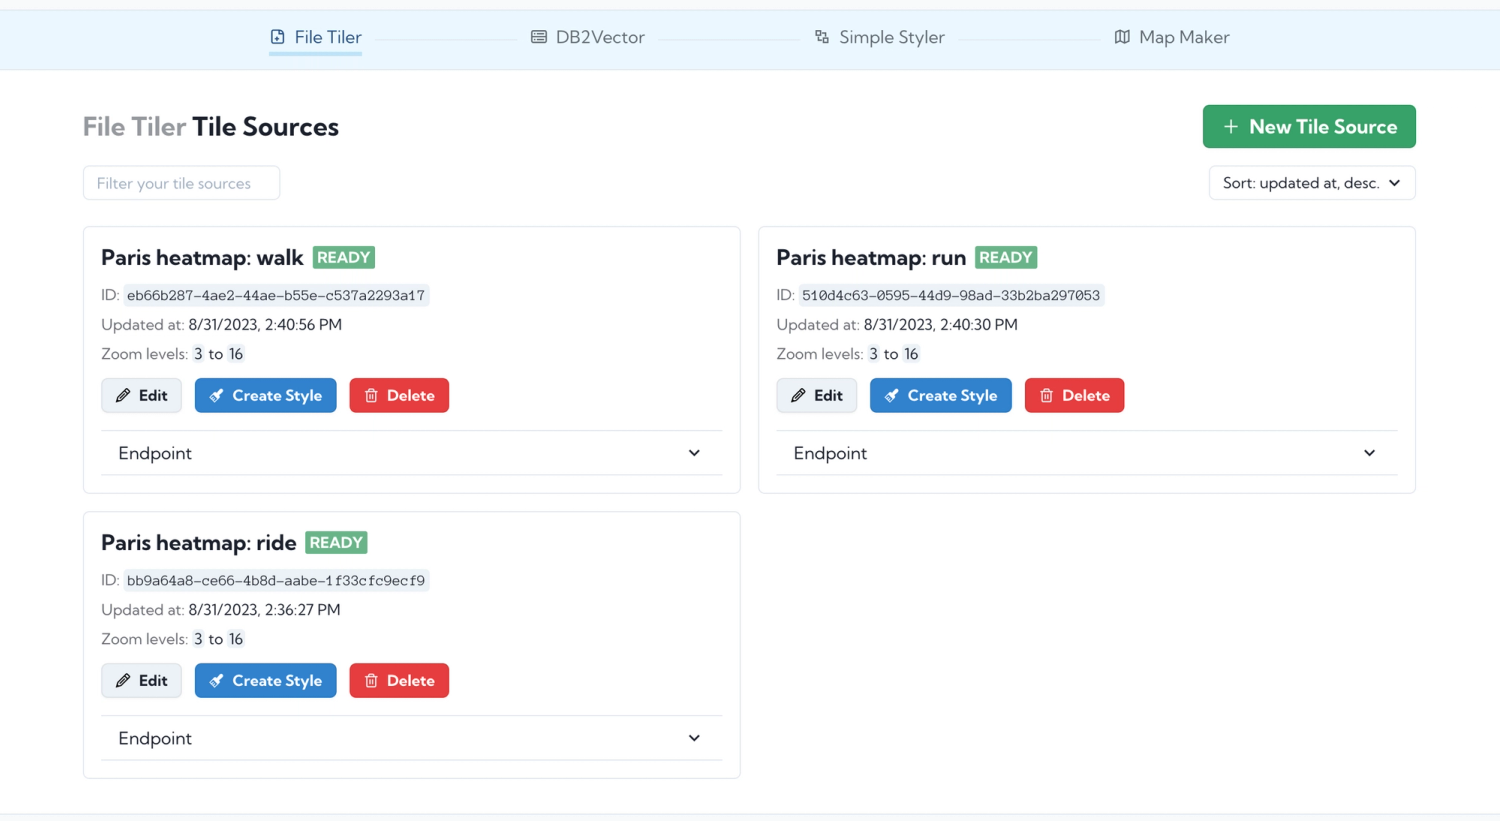
File Tiler index page.
Simple Styler: style and color tiles
Having created three vector tile sources for each activity type, it's time to style each source to visually distinguish them. The Simple Styler editor allows you to configure a host of options related to how the tile source is rendered. I set the line blur to 1 and the line width to 3. After some trial and error, I determined that a line opacity of 40% was ideal to show overlapping tracks as darker while also being able to clearly see isolated tracks.
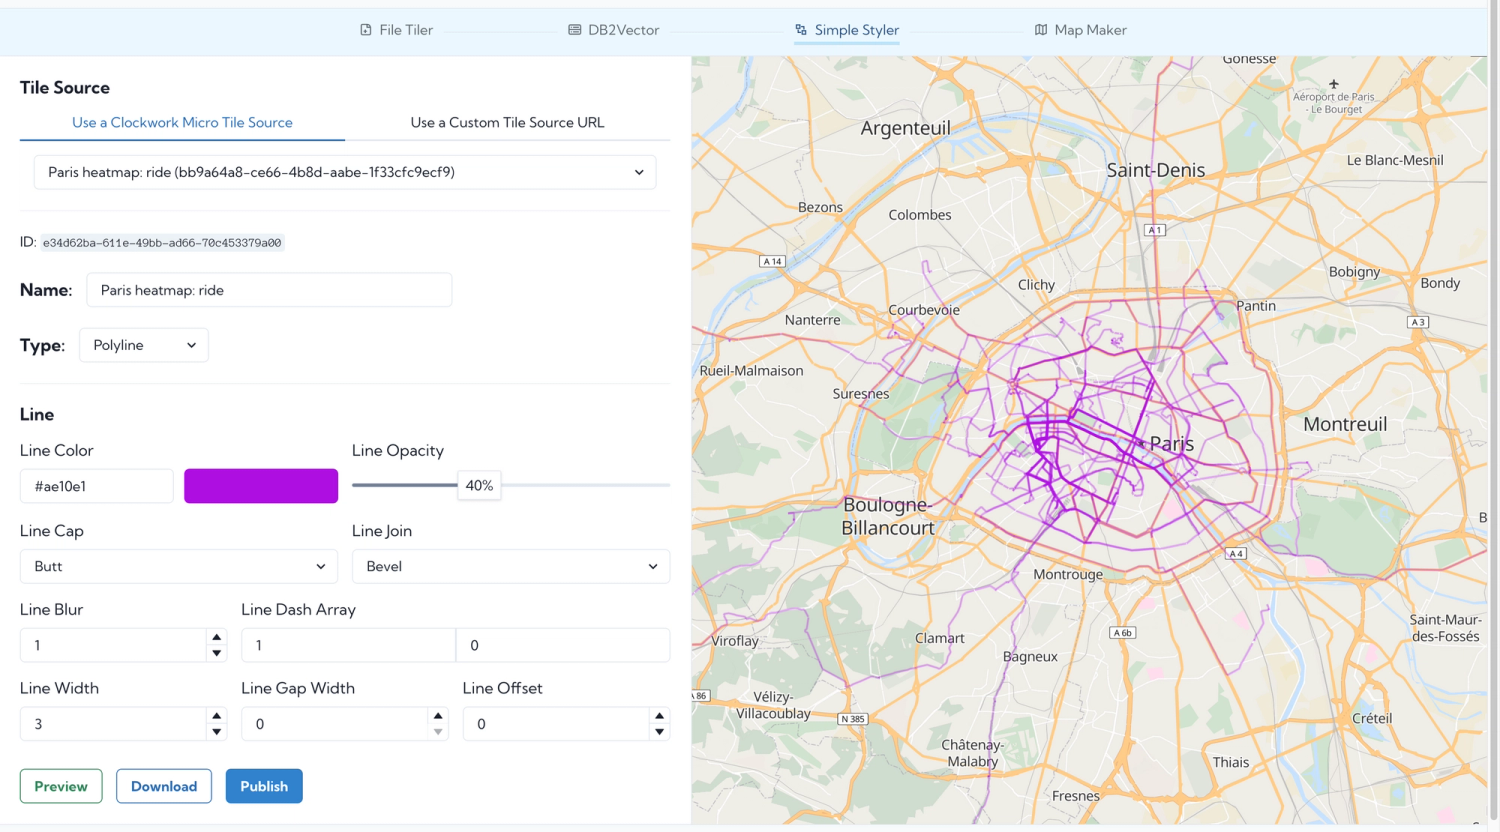
Simple Styler editor.
The only parameter that I changed between the three sources was line color. I decided on purple for rides, yellow for runs, and blue for walks.
Map Maker: publish the map
Finally, I'm on to stacking each styled tile source atop a basemap to form a complete map. The ordering is important: because my rides are so numerous, I moved the rides layer to the bottom to allow runs and walks to stand out more.
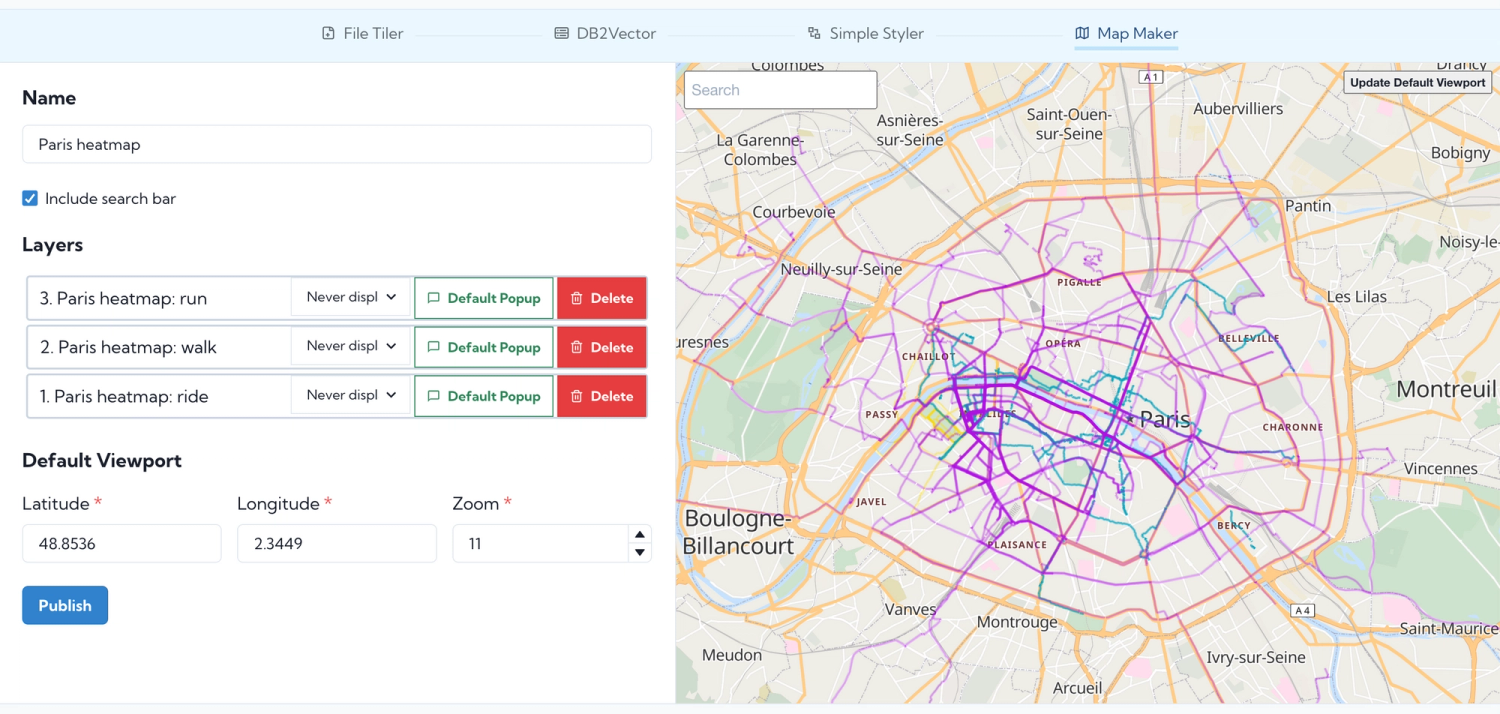
Map Maker editor.
Behold, the heatmap! Not bad for two months. Zoom out and to the west to see my weekend tour from Le Havre.
Conclusion
During my time in Paris, I:
- Rode 716.4 miles over 57.0 hours
- Ran 27.0 miles over 3.8 hours
- Walked 58.5 miles over 17.9 hours
While this specific heatmap is limited to just Paris, I have ideas to set up another visualization system that automatically syncs from Strava, perhaps through a webhook that pulls activity data and writes to a PostGIS database.